American Science News Analysis: Religiosity, Party Affiliation, and Social Media
Lama Ahmad
12/3/2018
Background Information
There are various issues that relate to science and technology in the political sphere today. We see many political actors on various sides of science related issues. For example, one of the most contentious issues today is climate change. Other issues that are visible include the use of natural gas, vaccinations, the ethics of genetic modification, and technology and data privacy.
To have an informed opinion about these issues it is important to read well-written and reliable content about scientific advancements and issues. Social media has certainly changed the way we consume news (including science news). While on one hand social media could be making conttent more accessible to a broader audience, it is also more difficult to discern what is reliable content vs what is propaganda.
The survey data used is from the 2017 Pew Research Center survey of U.S. adults about science news and information. The survey had a sample size of 4,024 adults, 18 years of age or older, living in all 50 U.S. states and the District of Columbia. Retrieved from: http://www.journalism.org/dataset/2017-pew-research-center-science-and-news-survey/
Click here to see the code for this analysis: https://github.com/lama-ahmad/DataAnalysis-R/blob/master/sciencenews.Rmd
Hypotheses
Politicized identities including racial identities, political party affiliation and ideology, and religious groups are hypothesized to engage with social media and science concepts in different ways. I am interested in how these hypotheses intersect, and in this paper I will test the following ideas:
Hypothesis 1: As frequency of religious service attendance increases, interest in science news decreases and frequency of reading science news decreases
Hypothesis 2: There are differences across political party affiliation in terms of interest in science news and frequency of reading science news
Hypothesis 3: There are differences among different groups of people who engage with science news on social media
HYPOTHESIS 1: Religiosity and Science News
Oveall, there is not a significant relationship between religiosity (measured by frequency of attending religious services) and interest in science news. For the purposes of this analysis, I recoded the interest likert scale to interested / not interested as a binary variable in order to use a logistic regression to calculate the probability of being interested in science news based on frequency of attending religious services. On average, people who frequently, infrequently, and never attend to religious services have a 68% probability of being interested in science news.

| Dependent variable: | |
| topicint | |
| rsattInfrequently | 0.087 |
| (0.083) | |
| rsattNever | 0.051 |
| (0.090) | |
| Constant | 0.968*** |
| (0.057) | |
| Observations | 4,001 |
| Log Likelihood | -2,319.756 |
| Akaike Inf. Crit. | 4,645.512 |
| Note: | p<0.1; p<0.05; p<0.01 |
In terms of probability of reading science news, I recoded the survey question to categorize people who frequently read science news (a few time or multiple times a week), as frequent readers (1), and others who answered a few times a month or less as infrequent readers (0). In this case, people who frequently or infrequently attend religious services have a 59% probability on avereage of reading science news. People who never attend religious services have a 60% probability on average of reading science news. However, what is interesting is looking at the confidence intervals of the frequent vs infrequent religious service attendees - frequent attendees can go as low as 58% probability of reading science news and infrequent attendees can go as high as a 60% probability of reading science news.

| Dependent variable: | |
| readsci | |
| rsattInfrequently | 0.096 |
| (0.076) | |
| rsattNever | 0.192** |
| (0.082) | |
| Constant | -0.585*** |
| (0.053) | |
| Observations | 4,012 |
| Log Likelihood | -2,656.255 |
| Akaike Inf. Crit. | 5,318.510 |
| Note: | p<0.1; p<0.05; p<0.01 |
I looked at whether frequency of religious attendance and the probability of reading science news depended on gender. While the results again showed that there is not a significant relationship between frequency of religious attendance and probability of reporting interest in science news, it is notable that women had a lower probability than men of being interested in science news across the board. On average, women have a 2% lower probability than men of being interested in science news.

| Dependent variable: | |
| topicint | |
| rsattInfrequently | 0.057 |
| (0.132) | |
| rsattNever | -0.082 |
| (0.134) | |
| PPGENDERFemale | -0.609*** |
| (0.117) | |
| rsattInfrequently:PPGENDERFemale | 0.050 |
| (0.171) | |
| rsattNever:PPGENDERFemale | 0.169 |
| (0.183) | |
| Constant | 1.309*** |
| (0.091) | |
| Observations | 4,001 |
| Log Likelihood | -2,290.760 |
| Akaike Inf. Crit. | 4,593.521 |
| Note: | p<0.1; p<0.05; p<0.01 |
Women experience the greatest variation in likelihood of reading science news compared to Men. Women who infrequently attend religious services have a 57% probability of reading science news, women who frequently attend religious services have a 58% probability of reading science news, and women who never attend religious services have a 60% probability of reading science news. By contrast, men have an avereage of 61% probability of reading science news across the board.

| Dependent variable: | |
| readsci | |
| rsattInfrequently | -0.033 |
| (0.107) | |
| rsattNever | -0.056 |
| (0.112) | |
| PPGENDERFemale | -0.891*** |
| (0.109) | |
| rsattInfrequently:PPGENDERFemale | 0.272* |
| (0.155) | |
| rsattNever:PPGENDERFemale | 0.449*** |
| (0.168) | |
| Constant | -0.145* |
| (0.074) | |
| Observations | 4,012 |
| Log Likelihood | -2,600.099 |
| Akaike Inf. Crit. | 5,212.197 |
| Note: | p<0.1; p<0.05; p<0.01 |
People who have a bachelor’s degree or higher have the highest probability of being interested in science news at about 70% on average regardless of frequency of religious service attendance.
People who have some college education have a 67% average probability of being interested in science news if they infrequently attend religious services, and a 68% average probability of being interested in science news if they frequently or never attend religious services.
People who have a high school education have a 65% average probability of being interested in science news across all frequencies of attending religious services.
People who have less than a high school education that have never or frequently attend religious services have a 64% average probability of being interested in science news, and people who infrequently attend religious services have a 65% average probability of being interested in science news.

| Dependent variable: | |
| topicint | |
| rsattInfrequently | 0.116 |
| (0.281) | |
| rsattNever | -0.090 |
| (0.286) | |
| PPEDUCATHigh school | 0.071 |
| (0.215) | |
| PPEDUCATSome college | 0.583*** |
| (0.218) | |
| PPEDUCATBachelor’s degree or higher | 1.182*** |
| (0.218) | |
| rsattInfrequently:PPEDUCATHigh school | -0.140 |
| (0.316) | |
| rsattNever:PPEDUCATHigh school | 0.175 |
| (0.325) | |
| rsattInfrequently:PPEDUCATSome college | 0.094 |
| (0.323) | |
| rsattNever:PPEDUCATSome college | 0.222 |
| (0.333) | |
| rsattInfrequently:PPEDUCATBachelor’s degree or higher | 0.076 |
| (0.327) | |
| rsattNever:PPEDUCATBachelor’s degree or higher | 0.340 |
| (0.344) | |
| Constant | 0.384** |
| (0.189) | |
| Observations | 4,001 |
| Log Likelihood | -2,217.223 |
| Akaike Inf. Crit. | 4,458.446 |
| Note: | p<0.1; p<0.05; p<0.01 |
People who have a bachelor’s degree or higher have the highest probability of being frequent readers of science news at about 62% if they frequently attend religious services, and 64% if they infrequently or never attend religious services.
People who have some college education have a 60% average probability of being frequent readers of science news if they frequently or infrequently attend religious services, and a 63% average probability of being frequent readers of science news if they never attend religious services.
People who have a high school education have a 56% average probability of being frequent readers of science news if they attend religious services frequently, and a 57% average probability of being frequent readers of science news if they attend religious services infrequently or never.
People who have less than a high school education that infrequently or frequently attend religious services have a 58% average probability of being frequent readers of science news, and a 57% average probability of being frequent readers of science news if they never attend religious services.

| Dependent variable: | |
| readsci | |
| rsattInfrequently | -0.018 |
| (0.314) | |
| rsattNever | -0.319 |
| (0.339) | |
| PPEDUCATHigh school | -0.321 |
| (0.245) | |
| PPEDUCATSome college | 0.465** |
| (0.235) | |
| PPEDUCATBachelor’s degree or higher | 0.990*** |
| (0.227) | |
| rsattInfrequently:PPEDUCATHigh school | 0.162 |
| (0.358) | |
| rsattNever:PPEDUCATHigh school | 0.491 |
| (0.384) | |
| rsattInfrequently:PPEDUCATSome college | -0.062 |
| (0.346) | |
| rsattNever:PPEDUCATSome college | 0.738** |
| (0.372) | |
| rsattInfrequently:PPEDUCATBachelor’s degree or higher | 0.321 |
| (0.337) | |
| rsattNever:PPEDUCATBachelor’s degree or higher | 0.651* |
| (0.365) | |
| Constant | -1.053*** |
| (0.212) | |
| Observations | 4,012 |
| Log Likelihood | -2,500.834 |
| Akaike Inf. Crit. | 5,025.668 |
| Note: | p<0.1; p<0.05; p<0.01 |
Although the differences are not statistically significant, there are some interesting patterns that emerge when we look at frequency of religious service attendance and interest in science news by ethnicity.
The least change happens across White people. They are 68% likely to be interested in science news across all frequencies.
Black people who frequently attend religious services are 66% likely to be interested in science news, Black people who infrequently attend religious services are 68% likely to be interested in science news, and black people who never attend religious services are 65% likely to be interested in science news.
People who are categorized as other are 67% likely to be interested in science news if they frequently attend religious services, 71% likely to be interested in science news if they infrequently attend religious services, and 66% likely to be interested in science news if they never attend religious services.
People who are Hispanic are 67% likely to be interested in science news if they frequently attend religious services, 69% likely to be interested in science news if they infrequently attend religious services, and 68% likely to be interested in science news if they never attend religious services.
For people who are 2+ Races and frequently attend religious services, they are 66% on average likely to be interested in science news, infrequently and never 67% on average likely to be interested in science news

| Dependent variable: | |
| topicint | |
| rsattInfrequently | -0.025 |
| (0.102) | |
| rsattNever | -0.013 |
| (0.108) | |
| PPETHMBlack, Non-Hispanic | -0.506*** |
| (0.168) | |
| PPETHMOther, Non-Hispanic | -0.299 |
| (0.293) | |
| PPETHMHispanic | -0.263 |
| (0.164) | |
| PPETHM2+ Races, Non-Hispanic | -0.373 |
| (0.313) | |
| rsattInfrequently:PPETHMBlack, Non-Hispanic | -0.024 |
| (0.255) | |
| rsattNever:PPETHMBlack, Non-Hispanic | -0.159 |
| (0.318) | |
| rsattInfrequently:PPETHMOther, Non-Hispanic | 1.152** |
| (0.505) | |
| rsattNever:PPETHMOther, Non-Hispanic | -0.063 |
| (0.424) | |
| rsattInfrequently:PPETHMHispanic | 0.490* |
| (0.266) | |
| rsattNever:PPETHMHispanic | 0.314 |
| (0.327) | |
| rsattInfrequently:PPETHM2+ Races, Non-Hispanic | 0.163 |
| (0.422) | |
| rsattNever:PPETHM2+ Races, Non-Hispanic | 0.270 |
| (0.468) | |
| Constant | 1.097*** |
| (0.072) | |
| Observations | 4,001 |
| Log Likelihood | -2,302.925 |
| Akaike Inf. Crit. | 4,635.850 |
| Note: | p<0.1; p<0.05; p<0.01 |
Breaking up the data by region (Northeast, Midwest, South, and West) also yields some interesting results.
People in the West who infrequently and never attend religous services have the highest probability of being interested in science news. People in the West who infrequently and never attend religious services have a 71% or 70% probability on average of being interested in science news.
People in the South do not experience much change in probability of being interested in science news whether they frequently, infrequently, or never attend religious services. They all have a 68% probability on average of being interested in science news.
People in the Midwest who frequently and infrequently attend religious services have a 67% probability on average of being interested in science news. Interestingly, people in the Midwest who never attend religious services have a 66% probability on average of being interested in science news.
There is a similar trend in the Northeast, where people who frequently and infrequently attend religious services have a 68% probability on average of being interested in science news. Peole in the Northeast who never attend religious services have a 67% probability on average of being interested in science news.

| Dependent variable: | |
| topicint | |
| rsattInfrequently | -0.011 |
| (0.205) | |
| rsattNever | -0.173 |
| (0.218) | |
| PPREG4Midwest | -0.109 |
| (0.200) | |
| PPREG4South | -0.187 |
| (0.180) | |
| PPREG4West | -0.097 |
| (0.198) | |
| rsattInfrequently:PPREG4Midwest | -0.148 |
| (0.267) | |
| rsattNever:PPREG4Midwest | -0.146 |
| (0.291) | |
| rsattInfrequently:PPREG4South | 0.028 |
| (0.244) | |
| rsattNever:PPREG4South | 0.241 |
| (0.265) | |
| rsattInfrequently:PPREG4West | 0.689** |
| (0.290) | |
| rsattNever:PPREG4West | 0.643** |
| (0.291) | |
| Constant | 1.092*** |
| (0.157) | |
| Observations | 4,001 |
| Log Likelihood | -2,300.542 |
| Akaike Inf. Crit. | 4,625.084 |
| Note: | p<0.1; p<0.05; p<0.01 |
HYOPTHESIS 2: Interest in Science News by Party Affiliation
Democrats and Independents had an average of 68% probability of being interested in science news. Republicans had an average of 66% probability of being interested in science news. People who indicated their party affiliation as ‘Something Else’ had an avereage of 67% probability of being interested in science news.

| Dependent variable: | |
| topicint | |
| PARTYRepublican | 0.396 |
| (0.245) | |
| PARTYDemocrat | 0.810*** |
| (0.245) | |
| PARTYIndependent | 0.746*** |
| (0.246) | |
| PARTYSomething else, please specify | 0.428 |
| (0.278) | |
| Constant | 0.383 |
| (0.237) | |
| Observations | 4,006 |
| Log Likelihood | -2,308.426 |
| Akaike Inf. Crit. | 4,626.852 |
| Note: | p<0.1; p<0.05; p<0.01 |
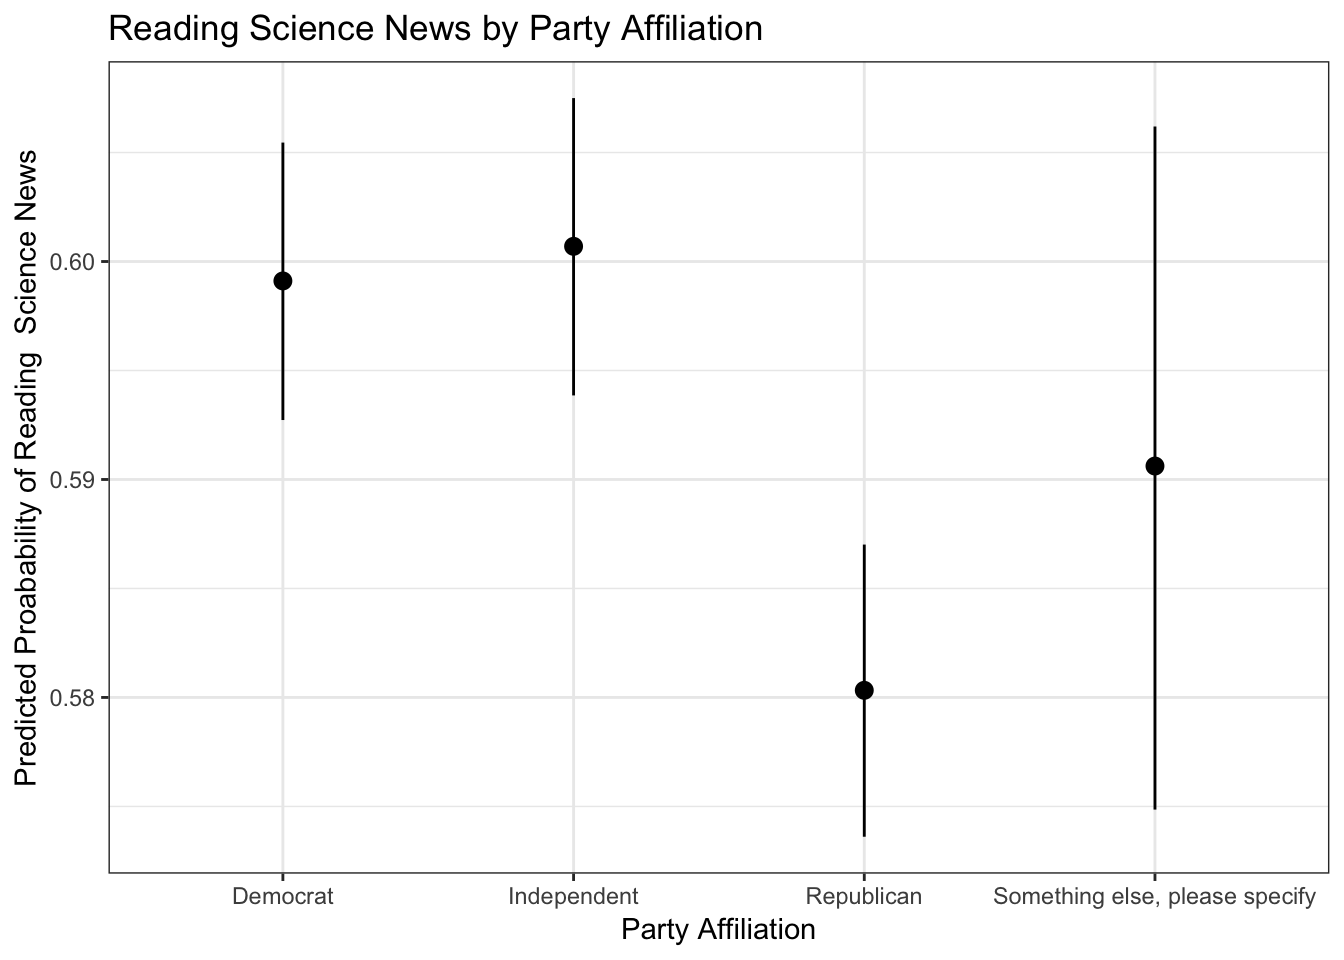
Democrats and Independents had an average of 60% probability of being frequent readers of science news. Republicans had an average of 58% probability of being frequent readers of science news. People who indicated their party affiliation as ‘Something Else’ had an avereage 67% probability of being frequent readers of science news.
HYPOTHESIS 3: Social Media Science News Engagement Differences
The social media engagement score variable (SMScore) encompasses responses about frequency of social media use, the types of science accounts a person follows, and their engagement with social media science news posts into a numeric score ranging from 0 to 17. 0 is the least engaged with science news via social media, while 17 is the most engaged with science news via social media.
There are no significant differences in SMScore by region. On average, the Northeast has a score of 10.63, the Midwest has a score of 10.83, the South has a score of 10.91, and the West has a score of 10.99.

| Dependent variable: | |
| SMScore | |
| PPREG4Midwest | 0.194 |
| (0.186) | |
| PPREG4South | 0.278* |
| (0.169) | |
| PPREG4West | 0.361* |
| (0.186) | |
| Constant | 10.633*** |
| (0.138) | |
| Observations | 2,755 |
| R2 | 0.002 |
| Adjusted R2 | 0.0004 |
| Residual Std. Error | 3.089 (df = 2751) |
| F Statistic | 1.396 (df = 3; 2751) |
| Note: | p<0.1; p<0.05; p<0.01 |
There are no significant differences in SMScore by gender. Men have an average score of 10.91, and women have an average score of 10.82.

| Dependent variable: | |
| SMScore | |
| PPGENDERFemale | -0.094 |
| (0.119) | |
| Constant | 10.912*** |
| (0.089) | |
| Observations | 2,755 |
| R2 | 0.0002 |
| Adjusted R2 | -0.0001 |
| Residual Std. Error | 3.089 (df = 2753) |
| F Statistic | 0.623 (df = 1; 2753) |
| Note: | p<0.1; p<0.05; p<0.01 |
There are no significant differences in the average social media science news engaegment score among people with different frequencies of religious service attendance. People who frequently attend religious services have an average score of 10.76. People who infrequently attend religious services have an average score of 10.82. People who never attend religious services have an average score of 11.03.

| Dependent variable: | |
| SMScore | |
| rsattInfrequently | 0.075 |
| (0.136) | |
| rsattNever | 0.287* |
| (0.151) | |
| Constant | 10.757*** |
| (0.095) | |
| Observations | 2,753 |
| R2 | 0.001 |
| Adjusted R2 | 0.001 |
| Residual Std. Error | 3.087 (df = 2750) |
| F Statistic | 1.869 (df = 2; 2750) |
| Note: | p<0.1; p<0.05; p<0.01 |
There are significant differences in the average social media science news engagement score among political party affiliations. Republicans have the lowest average score at 10.59. Democrats have the highest average score of 11.05. Independents have a score of 10.94.

| Dependent variable: | |
| SMScore | |
| PARTYDemocrat | 0.460*** |
| (0.146) | |
| PARTYIndependent | 0.348** |
| (0.154) | |
| PARTYSomething else, please specify | 0.368 |
| (0.282) | |
| Constant | 10.589*** |
| (0.109) | |
| Observations | 2,716 |
| R2 | 0.004 |
| Adjusted R2 | 0.003 |
| Residual Std. Error | 3.072 (df = 2712) |
| F Statistic | 3.501** (df = 3; 2712) |
| Note: | p<0.1; p<0.05; p<0.01 |
People with a bachelor’s degree or higher and people with some college education have a significant difference in the social media science news engagement score, people who have a high school degree or less are less certain. On average, people with less than a high school degree have a score of 10.50. People with a high school degree have an average score of 10.38. People with some college have an average score of 10.92, and people with a bachelor’s degree or higher have an average score of 11.5.

| Dependent variable: | |
| SMScore | |
| PPEDUCATHigh school | -0.129 |
| (0.241) | |
| PPEDUCATSome college | 0.430* |
| (0.239) | |
| PPEDUCATBachelor’s degree or higher | 0.761*** |
| (0.234) | |
| Constant | 10.493*** |
| (0.213) | |
| Observations | 2,755 |
| R2 | 0.014 |
| Adjusted R2 | 0.013 |
| Residual Std. Error | 3.069 (df = 2751) |
| F Statistic | 13.042*** (df = 3; 2751) |
| Note: | p<0.1; p<0.05; p<0.01 |
Younger age groups (including 18-24, 25 - 34, and 35 - 44) tend to engage more with science news on social media than older age groups. On average, 18-24 year olds have a SMSscore of 11.03. 25-34 year olds have a score of 11.50, and 35 - 44 year olds have a score of 11.22. People age 45 - 54 have a score of 10.70, age 65 - 74 have a score of 10.46.

| Dependent variable: | |
| SMScore | |
| ppagecat25-34 | 0.468* |
| (0.254) | |
| ppagecat35-44 | 0.193 |
| (0.258) | |
| ppagecat45-54 | -0.339 |
| (0.255) | |
| ppagecat55-64 | -0.461* |
| (0.249) | |
| ppagecat65-74 | -0.543** |
| (0.268) | |
| ppagecat75+ | -1.652*** |
| (0.361) | |
| Constant | 11.040*** |
| (0.215) | |
| Observations | 2,755 |
| R2 | 0.024 |
| Adjusted R2 | 0.022 |
| Residual Std. Error | 3.055 (df = 2748) |
| F Statistic | 11.369*** (df = 6; 2748) |
| Note: | p<0.1; p<0.05; p<0.01 |
CONCLUSIONS
Hypothesis 1 which stated that: “As frequency of religious service attendance increases, interest in science news decreases and frequency of reading science news decreases” was not upheld. Religious service attendance alone did not do a good job of predicting interest in science news or reading science news. When interacting religious service attendance with other variables such as Gender or Education, we see a more nuanced picture of how religiosity could be interacting with other variables and thus affecting science news consumption, but over all religiosity does not seem to have an effect on interest and reading science news.
Hypothesis 2 which stated that: “There are differences across political party affiliation in terms of interest in science news and frequency of reading science news” was upheld, we see that Democrats and Independents and people who identify as Something Else have a higher probability of both being interested in science news and reading science news. The results of the logistic regression were significant in this case.
Hypothesis 3 which stated that: “There are differences among different groups of people who engage with science news on social media” was upheld, especially with regard to Age groups (Young vs. Old), Party Affiliation, and Education Level. Given these results, it is still unclear what the implications of science news engagement via social media are. It depends on the user’s discretion of what is reliable vs unreliable information, and what content platforms choose to prioritize, as well as the quality of the science journalism that is available and widely circulated on social media platforms. Further research would need to be conducted to understand the behaviors of different groups when engaging with science news on social media.
There are limitations to these conclusions, which include the fact that religious service attendance does not necessarily indicate religiosity, as different religions also have different ways of expressing religiosity that do not necessarily entail going to a religious service. However, it is a good indicator for common monotheistic religions pracrticed in the United States. There is also the issue of social desirability bias in self reported survey questions, especially with regard to frequency and interest in science news. I attempted to mitigate that by using both measures of interest as well as actual frequency of reading science news.
Click here to see the code: https://github.com/lama-ahmad/DataAnalysis-R/blob/master/sciencenews.Rmd